Disturbing new coronavirus map identifies most vulnerable areas

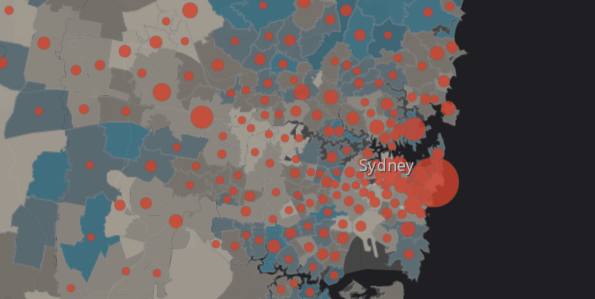
A new interactive map has been developed by the University of Sydney that identifies which NSW suburbs are most vulnerable if a cluster of coronavirus cases were to develop in those areas.
The university hopes its creation can aid the state government and influence policy making and ultimately the lifting of restrictions in certain areas earlier than others.
The map provides information on the socio-economic status of people as well as what percentage of the residents of that area are aged over 60.
“We hope it can inform state policy responses to COVID-19, including appropriate allocation of resources,” Associate Professor Kamradt-Scott, a former and current government adviser on pandemic strategy said.
In Sydney, vulnerable suburbs when it comes to age are the Northern Beaches suburbs of Palm Beach, where 44.9 per cent of its population is over 60, Bayview (46.1 per cent) and the Eastern Suburbs’ Darling Point (32.7 per cent).
All of Australia’s 63 deaths, 26 of those in NSW, have been people aged over 50.
The map also reveals when the last confirmed case was in a particular area, which can assist the government in decisions around potentially relaxing containment measures in “discrete, safe areas”.
“There will be a minimum of 28 days of no or small transmission that will have to have elapsed before an area is possibly cleared for relaxation,” Assoc Prof Kamradt-Scott said.
“The hope is that this process will enable the state to begin to get back to normal.”

Associate Professor Adam Dunn from the Faculty of Medicine and Health, hopes the government can use the new tool to “avoid much of the social, economic, and mental health harms caused by blanket policies that disproportionately burden vulnerable and marginalised communities”.
The map shows that the 2026 postcode, which covers the Bondi suburbs, has the largest amount of cases at 111.
It is one of the hotspots NSW Health have identified as a concern and has set up drive-in testing as well as a temporary clinic targeting the backpacker community.
While the city’s east was initially deemed as the biggest concern, focus is now shifting to the west where Penrith, Liverpool, Blacktown, Cumberland and Westmead have all been identified as new hotspots.
“In order to be sure that we are not having widespread community transmission in these areas, we are asking that everyone in these areas if they have even very mild symptoms to present to their GP, or to one of the COVID-19 clinics or go to hospital to seek testing,” NSW Health acting director Dr Christine Selvey said on Monday.
She said these areas were of great concern due to community transmission without a trace, which currently stands at 12 per cent of all cases across the state, the University of Sydney’s new interactive tool reveals.
NSW Premier Gladys Berejiklian has repeatedly stressed this particular statistic is the most concerning, while Associate Professor Ian Mackay at the University of Queensland, one of the country’s leading virologists, told Yahoo News Australia earlier this month that the figure was previously overshadowed by imported cases and had not gotten the attention it needed.
Do you have a story tip? Email: newsroomau@yahoonews.com.
You can also follow us on Facebook, Instagram and Twitter and download the Yahoo News app from the App Store or Google Play.